Showing posts with label Python. Show all posts

Monday, 13 January 2014

Breathing Detection with Kinect - A working Prototype Seizure Detector!

The seizure detector project has come forward a long way since I have been using the Kinect.
I now have a working prototype that monitors breathing and can alarm if the breathing rate is abnormally low.   It sends data to our 'bentv' monitors (image right), and has a web interface so I can see what it is doing (image below).   It is on soak test now.....

Details at http://openseizuredetector.org.uk.


Sunday, 5 January 2014

Breathing Detection using Kinect and OpenCV - Part 2 - Peak detection

A few days ago I published a post about how I am using a Microsoft Kinect depth camera and the OpenCV image processing library to identify a test subject from a background, and analyse the series of images from the camera to detect small movements.

The next stage is to calculate the brightness of the test subject at each frame, and turn that into a time series so we can see how it changes with time, and analyse it to detect specific events.

We can use the openCV 'mean' function to work out the average brightness of the test image easily, then just add it onto the end of an array, and trim the first value off the start to keep the length the same.
The resulting image and time series are shown below:

 The image here shows that we can extract the subject from the background quite accurately (this is Benjamin's body and legs as he lies on the floor).  the shading is the movement relative to the average position.


The resulting time series is shown here - the measured data is the blue spiky line.  The red one is the smoothed version (I know I have a half second offset between the two...).

The red dots are peaks detected using a very simple peak searching algorithm.
The chart clearly shows a 'fidget' being detected as a large peak.  There is a breathing event at about 8 seconds that has been detected too.

So, the detection system is looking promising - I have had better breathing detection when I was testing it on myself - I think I will have to change the position of the camera a bit to improve sensitivity.

I have now set up a simple python based web server to allow other applications to connect to this one to request the data.

We are getting there.  The outstanding issues are:

  • Memory Leak - after the application has run for 30 min the computer gets very slow and eventually crashes - I suspect a memory leak somewhere - this will have to be fixed!
  • Optimum camera position - I think I can get better breathing detection sensitivity by altering the camera position - will have to experiment a bit.
  • Add some code to identify whether we are looking at Benjamin or just noise - at the moment I analyse the largest bright subject in the image, and assume that is Benjamin - I should probably have a minimum size limit so it gives up if it can not see Benjamin.
  • Summarise what we are seeing automatically - "normal breathing", "can't see Benjamin", "abnormal breathing", "fidgeting" etc.
  • Modify our monitors that we use to keep an eye on Benjamin to talk to the new web server and display the status messages and raise an alarm if necessary.
The code is available here.


Wednesday, 1 January 2014

Breathing Detection using Kinect and OpenCV - Part 1 - Image Processing

I have had a go at detecting breathing using an XBox Kinnect depth sensor and the OpenCV image processing library.
I have seen a research paper that did breathing detection, but it relied on fitting the output of the Kinect to a skeleton model to identify the chest area to monitor.  I would like to do it with a less calculation intensive route, so am trying to just use image processing.

To detect the small movements of the chest during breathing, I am doing the following:
Start with a background depth image of empty room.

Grab a depth image from kinect
Subtract Background so we have only the test subject.


Subtract a rolling average background image, and amplify the resulting small differences - makes image very sensitive to small movements.


Resulting video shows image brightness changing due to chest movements from breathing.

We can calculate the average brightness of the test subject image - the value clearly changes due to breathing movements - job for tomorrow night is to do some statistics to work out the breathing rate from this data.

The source code of the python script that does this is the 'benfinder' program in the OpenSeizureDetector archive.

Tuesday, 31 December 2013

A Microsoft Kinect Based Seizure Detector?

Background

I have been trying to develop an epileptic seizure detector for our son on-and-off for the last year.   The difficulty is that it has to be non-contact as he is autistic and will not tolerate any contact sensors, and would not lie on a sensor mat etc.
I had a go at a video based version previously, but struggled with a lot of noise, so put it on hold.

At the weekend I read a book "OpenCV Computer Vision with Python" by Joseph Howse - this was a really good summary of how to combine openCV video processing into an application - dealing with separating user interface from video processing etc.   Most significantly he pointed out that it is now quite easy to use a Microsoft Kinect sensor with openCV (it looked rather complicated earier in the year when I looked), so thought I should give it a go.

Connecting Kinect

When I saw a Kinect sensor in a second hand gadgets shop on Sunday, I had to buy it and see what it can do.

The first pleasant surprise that I got was that it came with a power supply and had a standard USB plug on it (I thought I would have to solder a USB plug onto it) - I plugged it into my laptop (Xubuntu 13.10), and it was immediately detected as a Video4Linux webcam - a very good start.

System Software

I installed the libfreenect library and its python bindings (I built it from source, but I don't think I had to - there is an ubuntu package python-freenect which would have done it).

I deviated from the advice in the book here, because the Author suggested using the OpenNI library, but this didn't seem to work - looks like they no longer support Microsoft Kinect sensors (suspect it is a licensing issue...).   Also the particularly clever software to do skeleton detection (Nite) is not open source so you have to install it as a binary package, which I do not like.   It seems that the way to get OpenNI working with Kinect is to use a wrapper around libfreenect, so I decided to stick with libfreenect.

The only odd thing is whether you need to be root to use the kinect or not - sometimes it seems I need to access it as root, then after that it works as a normal user - will think about this later - must be something to do with udev rules, so not a big deal at the moment....

BenFinder Software

To see whether the Kinect looks promising to use as a seizure detector, wrote a small application based on the framework in Joseph Howse's book.   I had to modify it to work with libfreenect - basically it is a custom frame grabber.
The code does the following:
  • Display video streams from kinect, from either the video camera or the infrared depth camera on the kinect - works!  (switch between the two with the 'd' key).
  • Save an image to disk ('s' key).
  • Subtract a background image from the current image, and display the resulting image ('b' key).
  • Record a video (tab key).

The idea is that it should be able to distinguish Benjamin from the background reliably, so we can then start to analyse his image to see if his movements seem odd (those who know Benjamin will know that 'odd' is a bit difficult to define for him!).

Output

I am very pleased with the output - it looks like it could work - a few images:

Output from Kinect Video Camera (note the clutter to make detection difficult!)
Kinect Depth Camera Output - Note black hole created by open door.


Depth Camera Output with background image subtracted - note that the subject stands out quite clearly.
Example of me trying to do Benjamin-like behaviours to see if I can be detected.

Conclusion & What Next

Background subtraction from the depth camera makes the test subject stand out nice and clearly - should be quite easy to detect him computationally.
Next stage is to see if the depth camera is sensitive enough to detect breathing (when lying still) - will try by subtracting an each image from the average of the last 30 or so, and amplifying the differences to see if it can be seen.
If that fails, I will look at Skeltrack to fit a body model to the images and analyse movement of limbs (but this will be much more computationally costly).
Then I will have to look at infrastructure to deploy this - I will either need a powerful computer in Benjamin's room to interface with the Kinect and do the analysis, or maybe use a Raspberry Pi to interface with the kinect and serve the depth camera output as a video stream.

Looking promising - will add another post with the breathing analysis in the new year...

Thursday, 5 December 2013

Using a Kobo Ebook Reader as a Gmail Notifier

A certain person that I know well does not read her emails very often and sees it as a chore to switch on the computer to see if she has any.  And no, I can't interest her in a smartphone that will do email for her....This post is about making a simple device to hang on the wall like a small picture next to the calendar so she can always see if she has emails to know if it is worth putting the computer on.

I was in WH Smith the other day and realised that they were selling Kobo Mini e-book readers for a very good price (<£30).   When you think about it the reader is a small battery powered computer with wifi interface, a 5" e-ink screen with a touch screen interface.    This sounds like just the thing to hang on the wall and use to display the number of un-read emails.

Fortunately some clever people have worked out how to modify the software on the device - it runs linux and the manufacturers have published the open source part of the device firmware (https://github.com/kobolabs/Kobo-Reader).   I haven't done it myself, but someone else has compiled python to run on the device and use the pygame library to handle writing to the screen (http://www.mobileread.com/forums/showthread.php?t=219173).  Note that I needed this later build of python to run on my new kobo mini as some of the other builds that are available crashed without any error messages - I think this is to do with the version of some of the c libraries installed on the device.
Finally someone called Kevin Short wrote a programme to use a kobo as a weather monitor, which is very similar to what I am trying to do and was a very useful template to start from - thank you, Kevin! (http://www.mobileread.com/forums/showthread.php?t=194376).

The steps I followed to get this working were:

  • Enable telnet and ftp access to the kobo (http://wiki.mobileread.com/wiki/Kobo_Touch_Hacking)
  • Put python on the 'user' folder of the device (/mnt/onboard/.python).
  • Extend the LD_LIBRARY_PATH in /etc/profile to point to the new python/lib and pygame library directories.
  • Add 'source /etc/profile' into /etc/init.d/rcS so that we have access to the python libraries during boot-up.
  • Prevented the normal kobo software from starting by commenting out the lines that start the 'hindenburg' and 'nickel' applications in /etc/init.d/rcS.
  • Killed the boot-up animation screen by adding the following into rcS:
          killall on-animator.sh
          sleep 1
  • Added my own boot-up splash screen by adding the follwing to rcS:
          cat /etc/images/SandieMail.raw | /usr/local/Kobo/pickel showpic 
  • Enabled wifi networking on boot up by referencing a new script /etc/network/wifiup.sh in rcS, which contains:
          insmod /drivers/ntx508/wifi/sdio_wifi_pwr.ko
          insmod /drivers/ntx508/wifi/dhd.ko
          sleep 2
          ifconfig eth0 up
          wlarm_le -i eth0 up
          wpa_supplicant -s -i eth0 -c /etc/wpa_supplicant/wpa_supplicant.conf -C         /var/run/wpa_supplicant -B sleep 2
          udhcpc -S -i eth0 -s /etc/udhcpc.d/default.script -t15 -T10 -A3 -f -q
  • Started my new gmail notifier program using the following in rcS:
          cd /mnt/onboard/.apps/koboGmail
          /usr/bin/python gmail.py > /mnt/onboard/gmail.log 2>&1 &
The actual python program to do the logging is quite simple - it uses the pygame program to write to a framebuffer screen, but uses a utility called 'full_update' that is part of the kobo weather project to update the screen.   The program does the following:
  • Get the battery status, and create an appropriate icon to show battery state.
  • Get the wifi link status and create an appropriate icon to show the link state.
  • Get the 'atom' feed of the user's gmail account using the url, username and password stored in a configuration file.
  • Draw the screen image showing the number of unread emails, and the sender and subject of the first 10 unread mails, and render the battery and wifi icons onto it.
  • Update the kobo screen with the new image.
  • Wait a while (5 seconds at the moment for testing, but will make it longer in the future - 5 min would probably be plenty).
  • Repeat indefinitely.
The source code is in my github repository.

The resulting display is pretty basic, but functional as shown in the picture.

Things to Do

There are a few improvements I would like to make to this:
  1. Make it less power intensive by switching off wifi when it is not needed (it can flatten its battery in about 12 hours so will need to be plugged into a mains adapter at the moment).
  2. Make it respond to the power switch - you can switch it off by holding the power switch across for about 15 seconds, but it does not shutdown nicely - no 'bye' display on the screen or anything like that - just freezes.
  3. Get it working as a usb mass storage device again - it does usb networking at the moment instead, so you have to use ftp to update the software or log in and use vi to edit the configuration files - not user friendly.
  4. Make it respond to the touch screen - I will need to interpret the data that appears in /dev/input for this.  The python library evdev should help with interpreting the data, but it uses native c code so I need a cross compiler environment for the kobo to use that, which I have not set up yet.  Might be as easy to code it myself as I will only be doing simple things.
  5. Get it to flash its LED to show that there are unread emails - might have to modify the hardware to add a bigger LED that faces the front rather than top too.
  6. Documentation - if anyone wants to get this working themselves, they will need to put some effort in, because the above is a long way off being a tutorial.   It should be possible to make a kobo firmware update file that would install it if people are interested in trying though.


Sunday, 24 March 2013

Further Development of Video Based Seizure Detector

I have made a bit more progress with the video based epileptic seizure detector.

Someone on the OpenCV Google Plus page suggested that I look at the Lucas-Kanade feature tracking algorithm, rather than trying to analyse all of the pixels at once like I was doing.

This looks quite promising.  First you have to decide which features in the image to use - corners are good for tracking.  OpenCV has a neat cv.GoodFeaturesToTrack function which makes suggestions - you give it a couple of parameters, including a 'quality' parameter to help it choose.  This gives a list of (x,y) coordinates of the good features to track.  Note that this means 'good' mathematically, not necessarily the limbs of the test subject....

Once you have some features to track, OpenCV again provides a cv.CalcOpticalFlowPyrLK, where you give it the list of features, the previous image and a new image, and it calculates the locations of the features in the new image.

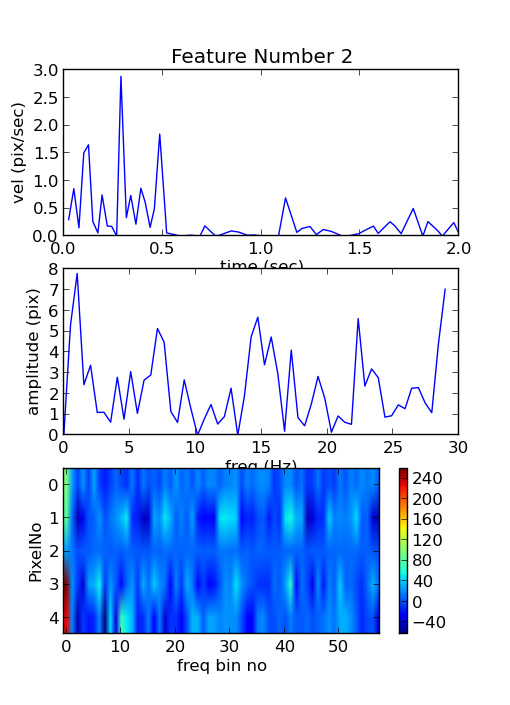
I have then gone into the fourier analysis that I have been trying for the other types of seizure detection. This time I calculate the speed of each feature over a couple of seconds, and record this as a time series, then calculate the fourier transform to give the frequency spectrum of the motion.   If there is oscillation above a threshold amplitude in a given frequency band for a specified time we raise an alarm as a possible seizure.

The code is functioning, but is a fair way off being operational yet.  The code for this is in my OpenSeizureDetector github repository (https://github.com/jones139/OpenSeizureDetector).

The current issues are:

  • I really want to track motion of limbs, but there is no guarantee that cv.GoodFeaturesToTrack will detect these as good features - I can make this more likely by attaching reflective tape, which glows under IR illumination from the night vision camera...if I can persuade Benjamin to wear it.
  • There is something wrong with the frequency calculation still - I can understand a factor of two, but it seems a bit more than that.
  • If the motion is too quick, it looses the point, so I have to set it to re-initialise using GoodFeaturesToTrack periodically.
  • An Example of it working with my daughter doing Benjamin-like behaviour is shown below.   Red circles are drawn around points if a possible seizure is detected.
  • This does not look too good - lots of points detected, and even the reflective strips on the wrists and ankles get lost.  It seems to work better in darkness though, where I get something like the second video, where there are only a few points, and most of those are on my high-vis reflective strips.

  • It does give some nice debugging graphs of the speed measurements and the frequency spectra though.
So, still a bit of work to do.....


Saturday, 9 March 2013

First go at a Video Based Epileptic Seizure Detector

Background

I have been working on a system to detect epileptic seizures (fits) to raise an alarm without requiring sensors to be attached to the subject.
I am going down three routes to try to do this:

  • Accelerometers
  • Audio
  • Video
This is about my first 'proof of concept' go at a video based system.

Approach

I am trying to detect the shaking of a fit.  I will do this by monitoring the signal from an infrared video camera, so it will work in monochrome.  The approach is:
  1. Reduce the size of the image by averaging pixels into 'meta pixels' - I do this using the openCV pyrDown function that does the averaging (it is used to build image pyramids of various resolution versions of an image).  I am reducing the 640x480 video stream down to 10x7 pixels to reduce the amount of data I have to handle.
  2. Collect a series of images to produce a time series of images.  I am using 100 images at 30 fps, which is about 3 seconds of video.
  3. For each pixel in the images, calculate the fourier transform of the series of measured pixel intensities - this gives the frequency at which the pixel intensity is varying.
  4. If the amplitude of oscillation at a given frequency is above a threshold value, treat this as a motion at that particular frequency (ie, it could be a fit).
  5. The final version will check that this motion continues for several seconds before raising an alarm.  In this test version, I am just  highlighting the detected frequency of oscillation on the original video stream.

Code

The code uses the OpenCV library, which provides a lot of video and image handling functions - far more than I understand...
My intention had been to write it in C, but I struggled with memory leaks (I must have been doing something wrong and not releasing storage, because it just ate all my computer's memory until it crashed...).
Instead I used the Python bindings for OpenCV - this ran faster and used much less memory than my C version (this is a sign that I made mistakes in the C one, rather than Python being better!).
The code for the seizure detector is here - very rough 'proof of concept' one at the moment - it will have a major rewrite if it works.

Test Set Up

To test the system, I have created a simple 'test card' video, which has a number of circles oscillating at different frequencies - the test is to see if I can pick out the various frequencies of oscillation.  The code to produce the test video is here....And here is the test video (not very exciting to watch I'm afraid).
The circles are oscillating at between 0 and 8 Hz (when played at 30 fps).

Results

The output of the system is shown in the video below.  The coloured circles indicate areas where motion has been detected.  The thickness of the line and the colour shows the frequency of the detected motion.
  • Blue = <3 hz="" li="">
  • Yellow = 3-6 Hz
  • Red = 6-9 Hz
  • White = >9 Hz

The things to note are:
  • No motion detected near the stationary 0 Hz circle (good!).
  • <3hz 1="" 2="" and="" circles="" detected="" good="" hz="" li="" motion="" near="" the="">
  • 3-6 Hz motion detected near the 2,3,4 and 5 Hz circles (ok, but why is it near the 2Hz one?)
  • 6-9 Hz motion detected near the 5 and 6 Hz circles (a bit surprising)
  • >9Hz motion detected near the 4 and 7 Hz circles and sometimes the 8Hz one (?)
So, I think it is sometimes getting the frequency too high.  This may be as simple as how I am doing the  check - it is using the highest frequency that exceeds the threshold.  I think I should update it to use the frequency with maximum amplitude (which exceeds the thershold).
Also, I have something wrong with positioning the markers to show the motion - I am having to convert from a pixel in the low res image to the location in the high resolution one, and it does not always match up with the position of the moving circles.

But, it is looking quite promising.  Rather computer intensive at the moment though - it is using pretty much 100% of one of the CPU cores on my Intel Core I5 laptop, so not much chance of getting this to run on a Raspberry Pi, which was my intention.


Sunday, 24 February 2013

Epileptic Seizure Detector (3)

I installed an accelerometer on the underside of the floorboard where my son sleeps to see if there is any chance of detecting him having an epileptic seizure by the vibrations induced in the floor.
I used the software for the seizure detector that I have been working with before (see earlier post).

The software logs data to an SD card in Comma-Separated-Values (CSV) format, recording the raw accelerometer reading, and the calculated spectrum once per second.  This left me with 26 MB of data to analyse after running it all night.....

I wrote a little script in Python that uses the matplotlib library to visualise it.   I create a 2 dimensional array where there is one column for each record in the file (ie once column per second).  The rows are the frequency bins from the fourier transform.  The values in the array are the amplitude of the spectral component from the fourier transform.
The idea is that I can look for periods where I have seen high levels of vibration at different frequencies to see if it could detect a seizure.  The results are shown below:
Here you can see the background noise of a few counts in the 1-7 Hz range.   The 13-15Hz signal is a mystery to me.  I wonder if it is the resonant frequency of our house?
Up to 170 sec is just me walking around the room - discouragingly little response - maybe something at about 10 Hz.  This is followed by me sitting still on the floorboard up to ~200 seconds (The 10 Hz signal disappears?)
The period at ~200 seconds is me stamping vigorously on the floorboard, to prove that the system is alive.
Unfortunately the period after 200 seconds is me lying on the floorboard shaking as vigorously as I could, and it is indistinguishable from the normal activity before 170 seconds.

So, I think attaching a simple IC accelerometer to a floorboard will not work - attaching it directly to the patient's forearm looks very promising, but not the floorboard.

I am working on an audio breathing detector now as the next non-contact option....

The code to analyse the data and produce the above chart can be found on github.  It uses the excellent matplotlib scientific visualisation package.

Sunday, 13 February 2011

OpenWRT Based Utility Meter Monitor

I have made some progress porting my MeterServ application (http://meterserv.webhop.net) to openWRT.   I have managed to work out how the openWRT makefile system works enough to add it to the build system and produce an openWRT package for the MeterServ application.
To do the improvements that I want to make to the application though, it needs more work.  In particular I don't like Perl, so want to convert the web interface part of it to Python.   Rather than go for a completely DIY web framework, I have adopted webpy (http://webpy.org) - this seems like a simplified version of django - you define URLs that you want the application to work with, then point it to a python class that does the processing associated with the user requesting a particular URL.
I have started a seperate google code project for meterserv, because a couple of people expressed an interest in it.  I have put the latest version of the software in its repository too - see http://code.google.com/p/meterserv.

Saturday, 8 January 2011

Building openWRT

I have got a little bifferboard single board computer which I intend to use to run pywws to send data from our weather station to the weather underground site on the internet.

The bifferboard comes installed with a very small linux distribution called openWRT.   It has a very small python installed, but no python USB support.

I have struggled a bit to work out how the openWRT package system works - the official wiki is a bit confused about what the current version is called (kamikaze or backfire).  It implies you can add packages by downloading them from svn, but this didn't seem to do anything.
I found a useful forum post here, which seems to be the best set of instructions.
You can do

./scripts/feeds update -a
This downloads the list of packages, but does not do anything else.
To get the buildroot system to compile it for you you need to 'install' it using:
./scripts/feeds install python 
./scripts/feeds install pyusb
You can then do "make menuconfig" and python and pyusb are shown to be compiled as packages "".
'make' actually compiles it.
I'll update this when I work out how to add these to the firmware image...

Wednesday, 29 December 2010

Personal Weather Station using NSLU2


While I wait for my new bifferboard to be delivered I thought I would get the weather station working and updating to weatherunderground.com using a Linksys NSLU2 that I have available.
The NSLU2 is already configured to run Linux.  There are quite a few varieties of NSLU2 linux, and I think this one was called OpenSlug when I installed it, but it now seems to be called SlugOSBE.
When I first set it up there was no python package available for it, so I had to write my utility meter monitoring program using Perl (yuk!).
Fortunately there is now a repository at http://ipkg.nslu2-linux.org/feeds/optware/slugosbe/cross/unstable/ that includes python packages.
To get python running (with USB support) on the NSLU2 I had to download the following packages from the repository, and install them with ipkg install .ipk:
libusb, libdb, libstdc++,ncursesw,readline,sqlite_3, zlib, python25, py25-usb

The python distribution did not put an executable in /usr/bin, so I had to do
ln -s /opt/bin/python2.5 /usr/bin/python

With all this installed I could plug the weather station into the NSLU2 (via a USB hub in my case) and pywws just worked.
I hope the bifferboard is as easy!

Tuesday, 28 December 2010

Personal Weather Station

I have just bought my wife, Sandie a personal weather station from Maplin.  It is a much better one than the simple one that broke recently - it has external humidity as well as temperature, plus wind speed and direction and rain detection.  Most importantly it has a USB connection so we should be able to connect it to an internet weather network so it can appear on our iGoogle home pages.

The maplin version is apparently a re-branded WH1080PC weather station - I chose this one rather than a more modern one because people have managed to get it working with Linux - I want to use a very low power single board computer to interface it, rather than a big PC running Windows.

I have chosen a bifferboard single board computer because it is cheap and has both USB and ethernet connections (I would have liked wireless lan too, but could not find something to do that, so I got the two USB port version of bifferboard, so will have a go at adding a USB wireless network interface card to it later).
My original idea was to use some software called meteoplug because you can buy a bifferboard with that already installed, so I know it would work.  However, when I looked into it, it is a subscription service that is not open source - all I really want to do is obtain data from the weather station and send it to weatherunderground, which can not be that difficult.
Fortunately there is an open source project, pywws, which is compatibly with the WH-1080PC weather station.
I thought it best to get it going on a desktop linux set-up first, then try to get it working on the single board computer.
From my Ubuntu 10.10 laptop I did:
svn checkout http://pywws.googlecode.com/svn/trunk/ pywws
sudo apt-get install python-usb
cd pywws 
python TestWeatherStation.py
Initially this gave an error "IOError: Claim interface failed", so I tried:
sudo python TestWeatherStation.py
Success - a string of numbers, and no errors!

To get rid of the requirement to run the program as root you have to tell 'udev' to give other users permission.
lsusb reports the vendor and product ID of the device (1941 and 8021 respectively), but this is actually reported as a USB missile launcher rather than a weather station.
I added a file called 05-weatherstation.rules to /etc/udev/rules.d, which contained the following line:

SUBSYSTEM=="usb", ATTRS{idVendor}=="1941", ATTRS{idProduct}=="8021", MODE:="0666", GROUP:="usb"

I also added a line to /etc/group to create the 'usb' group, and made myself a member of that group.
Re-started udev with 'sudo service udev restart', and now the test works without being root (note the colon in 'MODE:=' - it is very important!

pywws seems to work suspiciously well - creating a data directory (~/weather/data) and running

pywws/LogData.py -vvv ~/weather/data/
creates a file with some convincing looking numbers in it.   I have created a weather station on weatherunderground, so I think the next thing to do is install the weather station outside, then try to use pywws to send data to weatherunderground.

Sunday, 26 December 2010

Benjap - A program for children with Autism or Learning Difficulties

I have decided to write a program for our autistic son (who also has severe learning difficulties) with my daughter, Laura.
We have bought a Packard Bell OneTwo all-in-one PC with a touch screen to use for it.
This is because Benjamin will not use a keyboard or mouse, but I hope that the cause and effect will be more obvious using a touch screen.

The basic program is written in Python using the pygame library.   The structure is of a main application with big icons to select the other applications.
The various applications are (or will be):

  • Stars (a bit like the start of star-trek) you can change the origin of the stars that shoot towards the edge of the screen by pressing the touch screen.
  • Bounce:  Lots of bright coloured balls bouncing off each other and the edge of the screen (not very interactive at the moment!).
  • Comet:  Dragging your finger around the screen leaves a multi-coloured trail like a comet.
  • Fireworks:  Pressing the screen launches a firework that explodes colourfully.
I have started a new project page for the application at http://code.google.com/p/benjap.

More to follow....

Sunday, 12 December 2010

Townguide - progress at last!

You can't beat some really bad weather to help make progress with my nerdy jobs.
I have got Waldemar's django front end to townguide working (http://dtownguide.webhop.net), and have managed to make a few changes, including adding fancy tab things to the main map selection form.
There are still a few things to sort out:

  • The area selection on the map does not align properly with the mouse pointer - not sure why - must be something to do with OpenLayers projections...
  • Mapnik re-sizes the output map to match the bounding box, so townguide needs to check the actual map size to make sure the grid squares are right.
  • There is something funny about the output resolution - need to see what it is using - the output looks much higher resolution than I asked for, so I suspect there is a sum wrong somewhere!
  • Add the GPX track and waypoint plugins (they are just templates at the moment).
  • Add an option to suppress un-named ways - the 'None' in the street index can confuse people.
  • Reinstate other output formats - only 'poster' is working.

Tuesday, 2 February 2010

Townguide Web Service Working

Well, I think the townguide web service is working now (http://www.townguide.webhop.net).
There is a simple queue so it only renders one job at a time, and you can view the progress of your job through the queue.
The source code and early documentation is stored at http://code.google.com/p/townguide.
The main thing to fix now is the output resolution - if I increase the resolution (in dpi) of the output map too far, mapnik changes zoom level and reduces the size of the text, so it is no easier to read - I need to understand mapnik style sheets now....

Sunday, 3 January 2010

Town Guide Progress

The good thing about so much bad weather over Christmas was that I could do some nerdy work rather than going out walking or cycling.....
The town guide Python project has therefore made good progress. The program can now generate a PDF 'poster' that can include a street index, and labelled features from the map database (pubs, shops, tourist attractions etc.). A typical example is shown at http://www.townguide.webhop.net/example1_hartlepool.pdf.

I have set up a very rudimentary web service using a PHP script to call townguide.py to generate a town guide on demand at http://www.townguide.webhop.net. It is running on a very small computer, and there is no queue, so there is no saying what will happen if more than one person tries to use it at once - that is another job!

Sunday, 6 September 2009

Progress with IP Camera Viewer

The Edimax IP Camera seems to work fairly well, but the video stream seems to get interrupted every now and again, which makes the player crash - vlc just hangs, and mplayer exits.
I decided that exiting was better so I have written a simple pyGTK front end for mplayer to play the screen. It also includes a wireless network link quality monitor to help understand why it is not working - it is here as 'bentv'.

Note that bentv uses a library that I have started work on (named ntpylib for want of a better name) - so far it only contains one class, 'prefs', which deals with saving and loading of simple key/value data from XML files. It includes a dialog box that GUI programs (such as bentv.py) can use to allow the user to edit the data. prefs.py and prefs.glade need copying or linking into the bentv directory to make it work - there is no clever installer!

Sunday, 28 June 2009

A General Purpose Network Solver?

I often get frustrated if I want to solve a simple fluid flow or thermal problem that is in the form of a network with branches, parallel paths etc. These tend to be a bit to difficult for a "back of the envelope" solution, which is always my preferred approach, so you end up writing code to iterate to find solution.

The easy way would be to use a commercial package like Aspen Hysis, SINDA or ESATAN, but these are very expensive for the once a year or thereabouts that I need to solve something like this. It would be nice to have a simple, low cost solver available.

I thought there would be plenty of open source ones available, but I have not been able to find a simple network solver, so I am going to resort to writing it myself. I did do one once before, but I seem to have lost the source code....It never got finished properly anyway.

I have started the project at http://code.google.com/p/openproc. There is no code worth talking of there yet, but the Wiki describes the sort of design I am thinking of. Any offers of help greatly appreciated!

Wednesday, 15 April 2009

What has been happening?

I've been forgetting to update this with what has been happening.

WherewasI now has a Python/GTK front end that allows you to plot your GPX traces on a OpenStreetMap map to see where you were, as well as altitude profiles etc. It could still do with a few more features, but it does most of what I want at the moment.

I have decided to make a concerted effort to finish off mapping Hartlepool for OpenStreetMap. The main problem is that am better at cycling around collecting GPX traces than I am at recording the street names. This means I end up with lots of roads with no names - no use if anyone wants to search for an address....To do this I decided to use audio mapping by recording audio clips with my mobile phone. The clips are GeoTagged using data from a little bluetooth GPS receiver. I use GPSMid on the mobile phone. Unfortunately it does not produce the GPX file, or the audio clips in the correct format for the JOSM OpenStreetMap Editor. I wrote a little python script to do the conversion so you can see the positions of the audio clips in the JOSM Editor (See the OSM GPSMid Page for details.